Type of course:
Digital learning, Lesson
Language:
EN
Duration:
15 minutes
Workload:
1 hour
Proficiency:
Intermediate
Target:
Students, Workers
SUMMARY
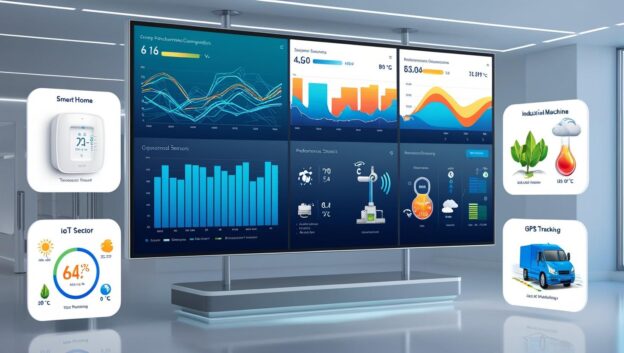
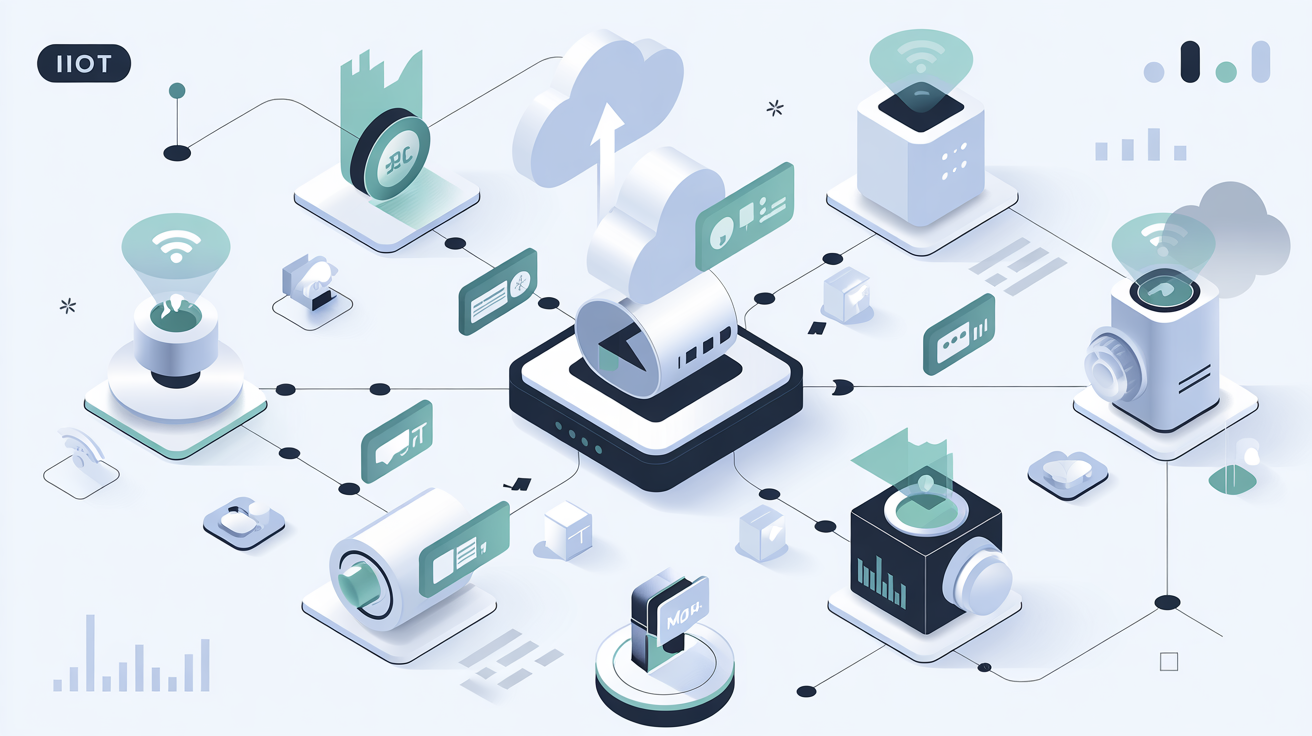
Grafana plays a major role in various IoT applications by providing real-time monitoring and visualization of data from different sources. It is used in smart home monitoring to track parameters such as temperature, humidity, and energy usage; in industrial IoT for monitoring machine performance and detecting anomalies; in environmental monitoring to visualize air quality, weather patterns, or water levels; and in fleet management to track vehicle locations and fuel consumption.
Grafana’s capabilities are also applied to specific domains such as agriculture, water management, and cultural preservation, where it helps optimize irrigation, manage water resources, and maintain appropriate conditions for artifacts. Building a dashboard in Grafana involves connecting data sources, configuring visualizations, and setting up alerts for a comprehensive overview of the monitored system.
About The Author
Beia Consult International is a R&D performing SME, founded in 1991, and it is one of the leading providers of telecommunications equipment and solutions in Romania for enterprise cloud communications and telemetry. BEIA has gained experience in providing trainings for different verticals, such as: green and digital transformation, blue economy, resource efficiency in manufacturing, etc. by participating in different projects aiming to provide education and training to the users.
Ioana Petre is a telecommunications engineer having experience in R&D&I projects for more than 7 years.
Learning outcomes
- Integrate Data Sources in Grafana – By the end of the course, learners will connect IoT data sources to Grafana for real-time monitoring.
- Design and Configure Dashboards – Within the course duration, learners will create customized Grafana dashboards with visualizations and alerts for decision-making.
- Apply Grafana for Performance Optimization – By the end of the course, learners will use Grafana features to monitor and optimize resources in domains like agriculture, fleet management, or server performance.
Course Content
Topics
Digital Transformation, Internet of Things (IoT)
Tags
iot, grafana dashboard, real-time analytics
Provided by
-
Beia Consult International

Course Includes
- 1 Quiz
Related
-
 Intermediate
Augmenting Workers
By Faculty of Engineering of University of PortoThis lesson discusses technologies that enhance human capabilities in the workplace, such as exoskeletons and augmented reality, empowering workers to perform complex tasks more efficiently and safely.
Digital learning, Lesson- Quiz1
-
 Intermediate
Data Analytics for Energy Efficiency and Sustainability
By Faculty of Engineering of University of PortoThis lesson focuses on using real-time data analytics to optimize energy usage in industrial settings, reducing waste, and improving sustainability through smart energy management systems.
Digital learning, Lesson- Quiz1
-
 Intermediate
Augmented Reality Application Development for Equipment Health Monitoring
By Laboratory for Manufacturing Systems and Automation of Patras - Laboratory for Manufacturing Systems and Automation of PatrasThis lesson teaches learners how to design Augmented Reality (AR) applications for monitoring equipment health. They will learn to formulate microservices for AR-based monitoring, create data monitoring and visualization workflows, and develop AR modules that provide real-time monitoring of equipment performance.
Digital learning, Lesson -
 Intermediate
Introduction to MQTT
By Beia Consult InternationalMessage Queuing Telemetry Transport (MQTT) is a lightweight messaging protocol for Internet of Things (IoT), using a publish/subscribe model for efficient, real-time communication. Common uses include smart homes, industrial automation, and environmental monitoring.
Digital learning, Lesson- Quiz1
-
 Intermediate
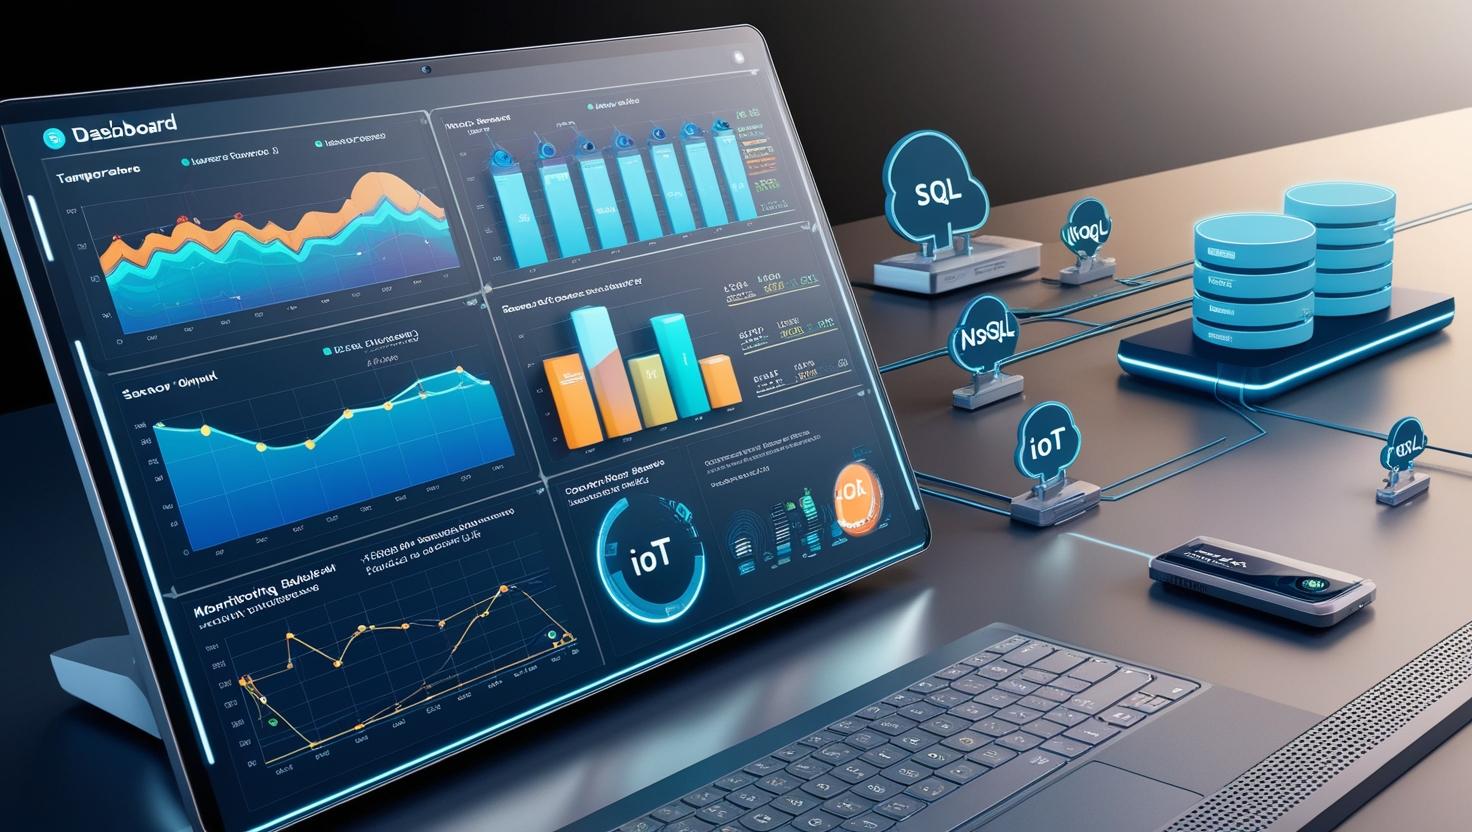
Introduction to Time Series Databases
By Beia Consult InternationalTime Series Databases (TSDBs) efficiently store and retrieve time-stamped data for applications like IoT, monitoring, and finance. They come in SQL-based (e.g., MySQL, PostgreSQL) for structured queries and NoSQL-based (e.g., InfluxDB, MongoDB) for scalability and high-velocity data handling. The choice depends on data volume, query complexity, and scalability needs.
Digital learning, Lesson- Quiz1
-
 Intermediate
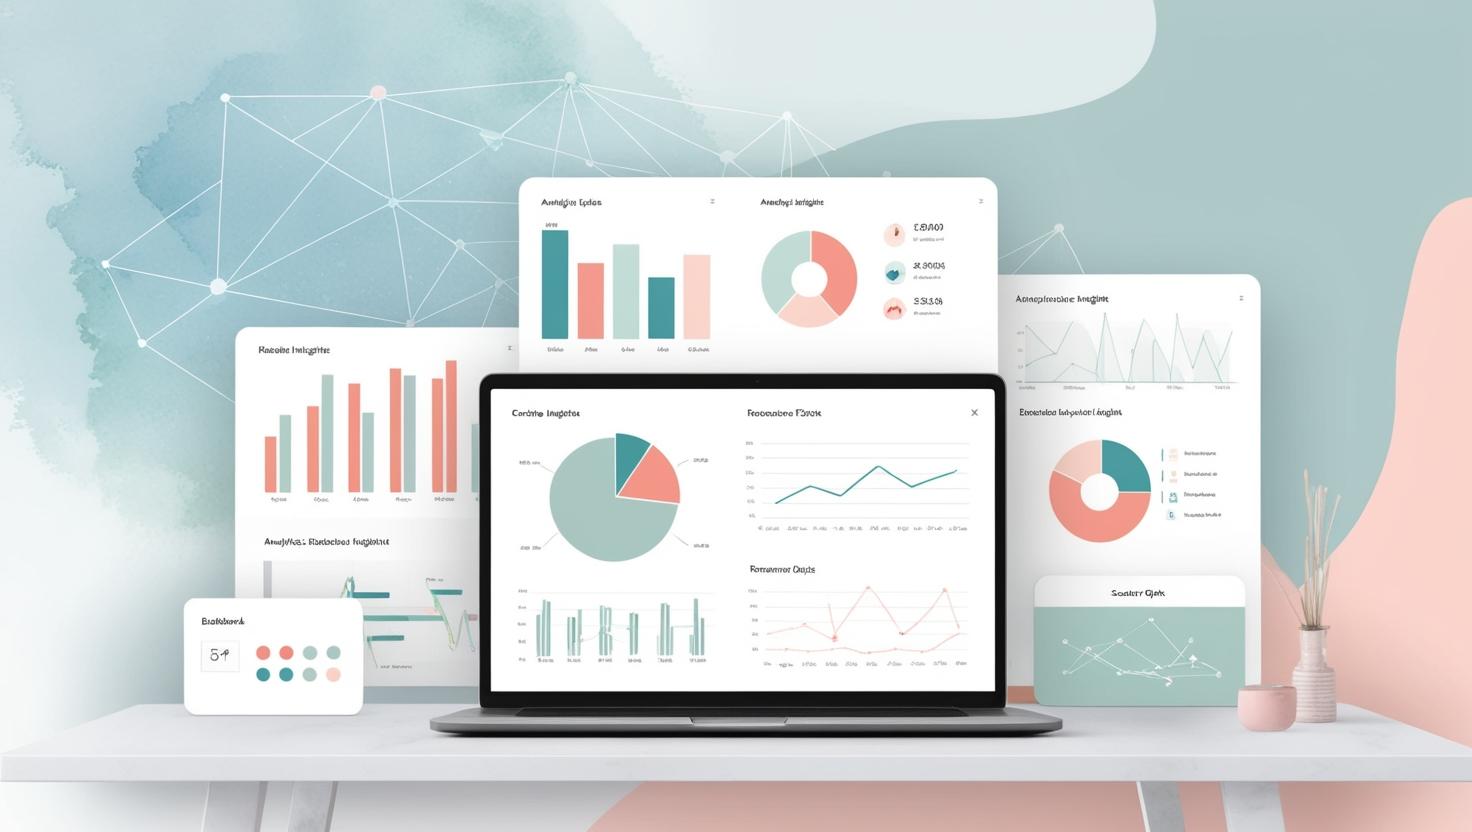
Introduction to Data Visualisation
By Beia Consult InternationalData visualization simplifies complex data through graphs, charts, and dashboards, enabling quick insights for decision-making. Grafana, a powerful open-source tool, supports real-time monitoring, interactive dashboards, and multi-source data integration for IoT, business intelligence, and analytics.
Digital learning, Lesson- Quiz1
-
 Beginner
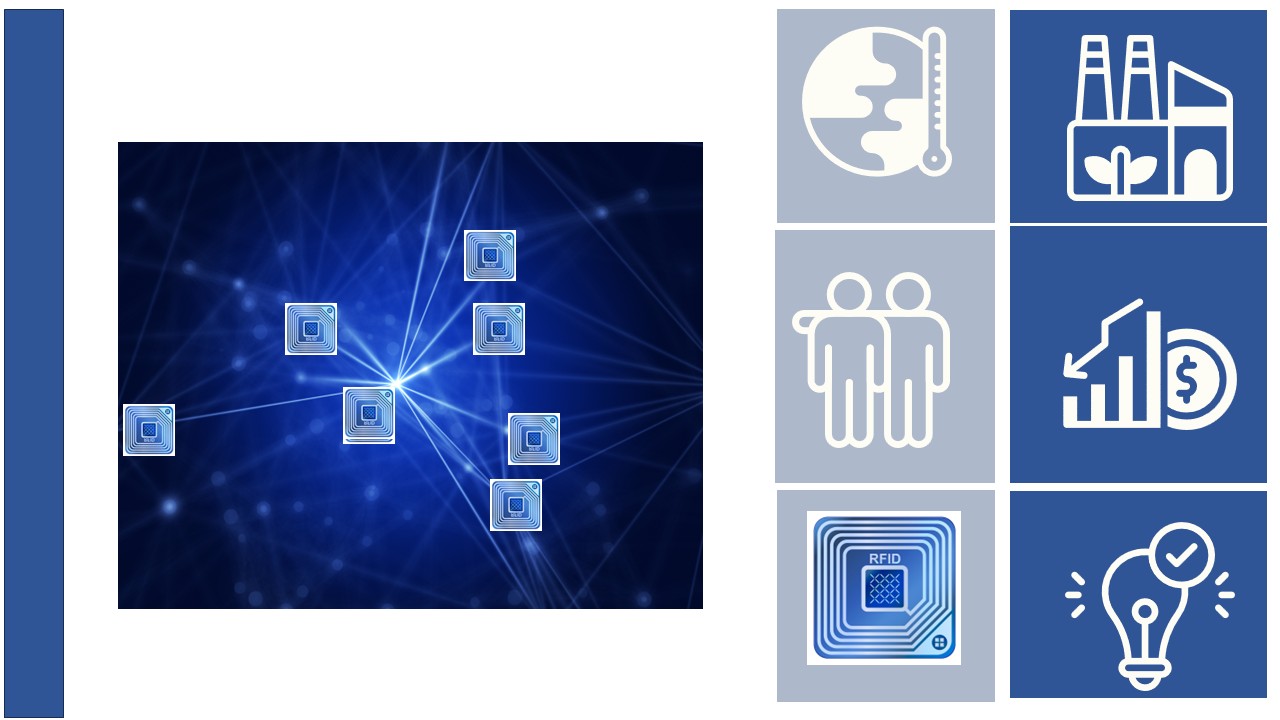
Track and Trace with Radio Frequency Identification
By JOANNEUM RESEARCHThis learning path is designed to provide students with an introduction to the concepts of Radio Frequency Identification technology for use in track and trace applications. This includes detailed explanations and descriptions of RFID readers, tags and Near Field Communication (NFC) technology.
Digital learning, Path- Course Certificate
49 € -
 Beginner
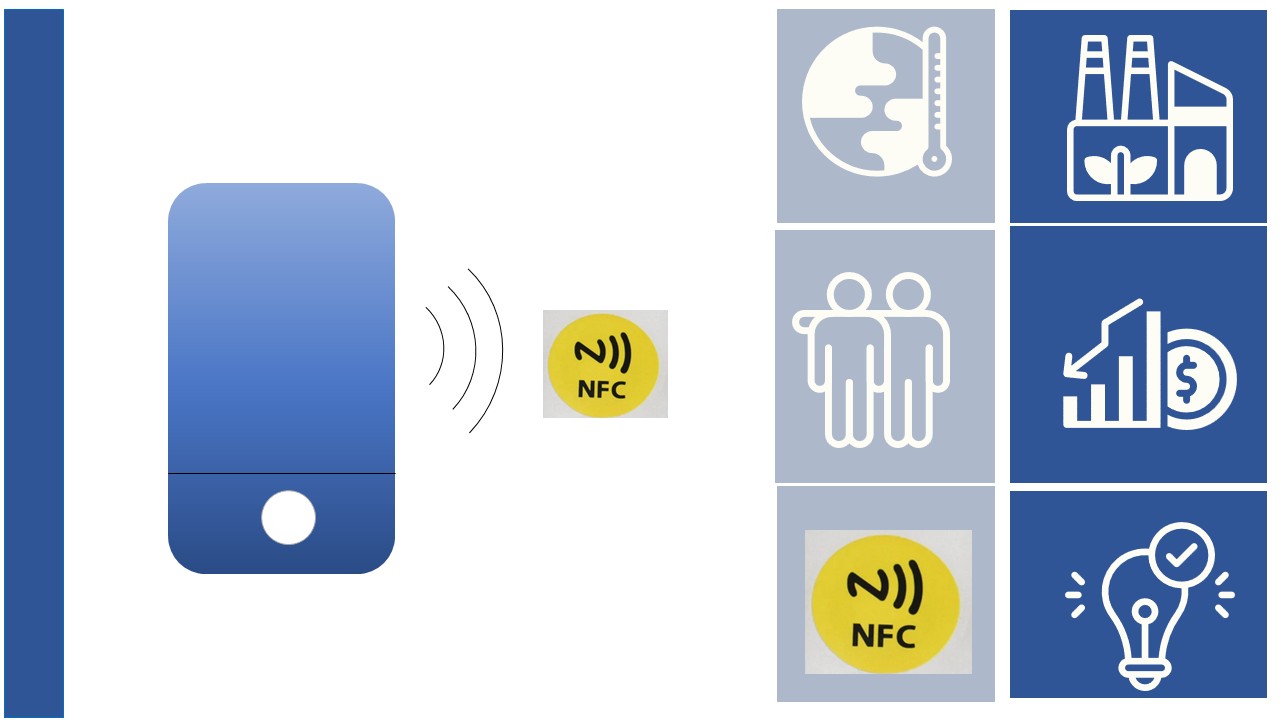
Near Field Communication
By JOANNEUM RESEARCHThis lesson explains Near Field Communication (NFC). NFC is a technology that allows you to interact securely with the world around you by simply touching it. NFC wireless technology is found in billions of smartphones, tablets, consumer and industrial electronics.
Digital learning, Lesson- Quiz1
-
 Beginner
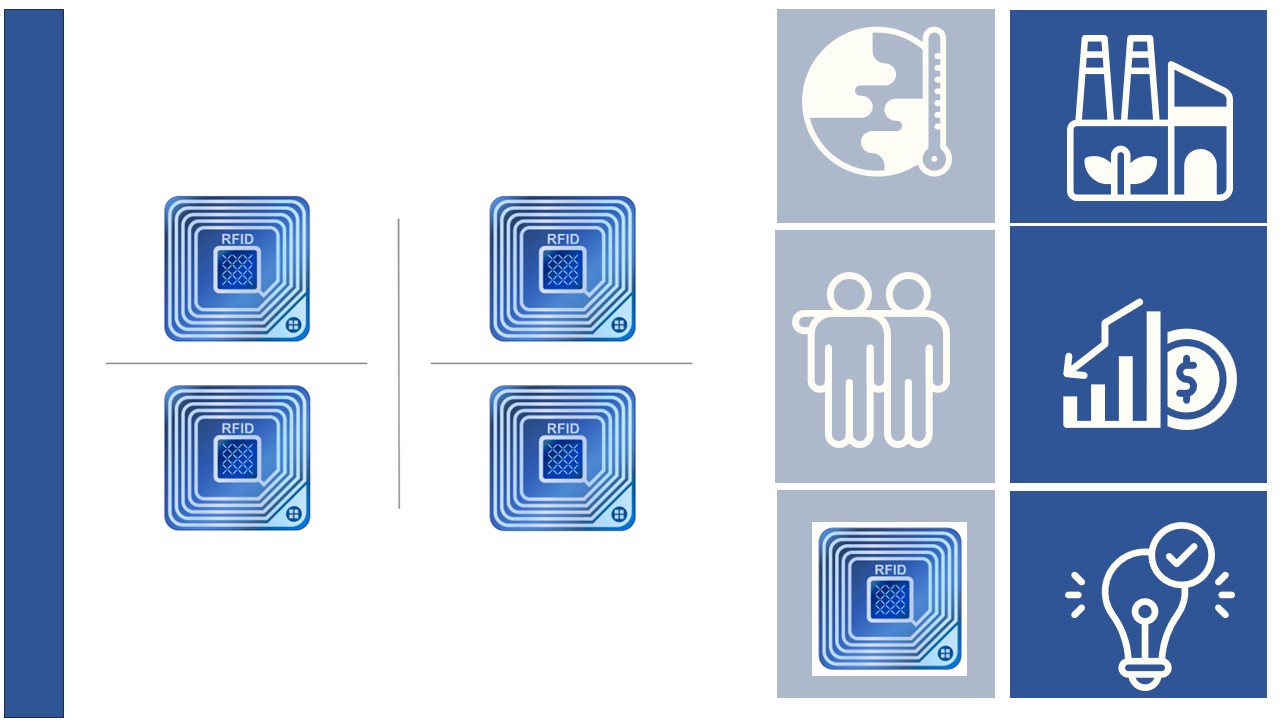
Radio Frequency Identification Tags
By JOANNEUM RESEARCHIn this lesson, we will describe Radio Frequency Identification (RFID) tags. RFID tags are small, wireless devices that use radio waves to identify and track objects. They consist of a microchip and an antenna, and can be attached to or embedded in a variety of objects to enable automated data collection and management. There are many different RFID tags to choose from, depending on the application and environmental factors.
Digital learning, Lesson- Quiz1
-
Beginner
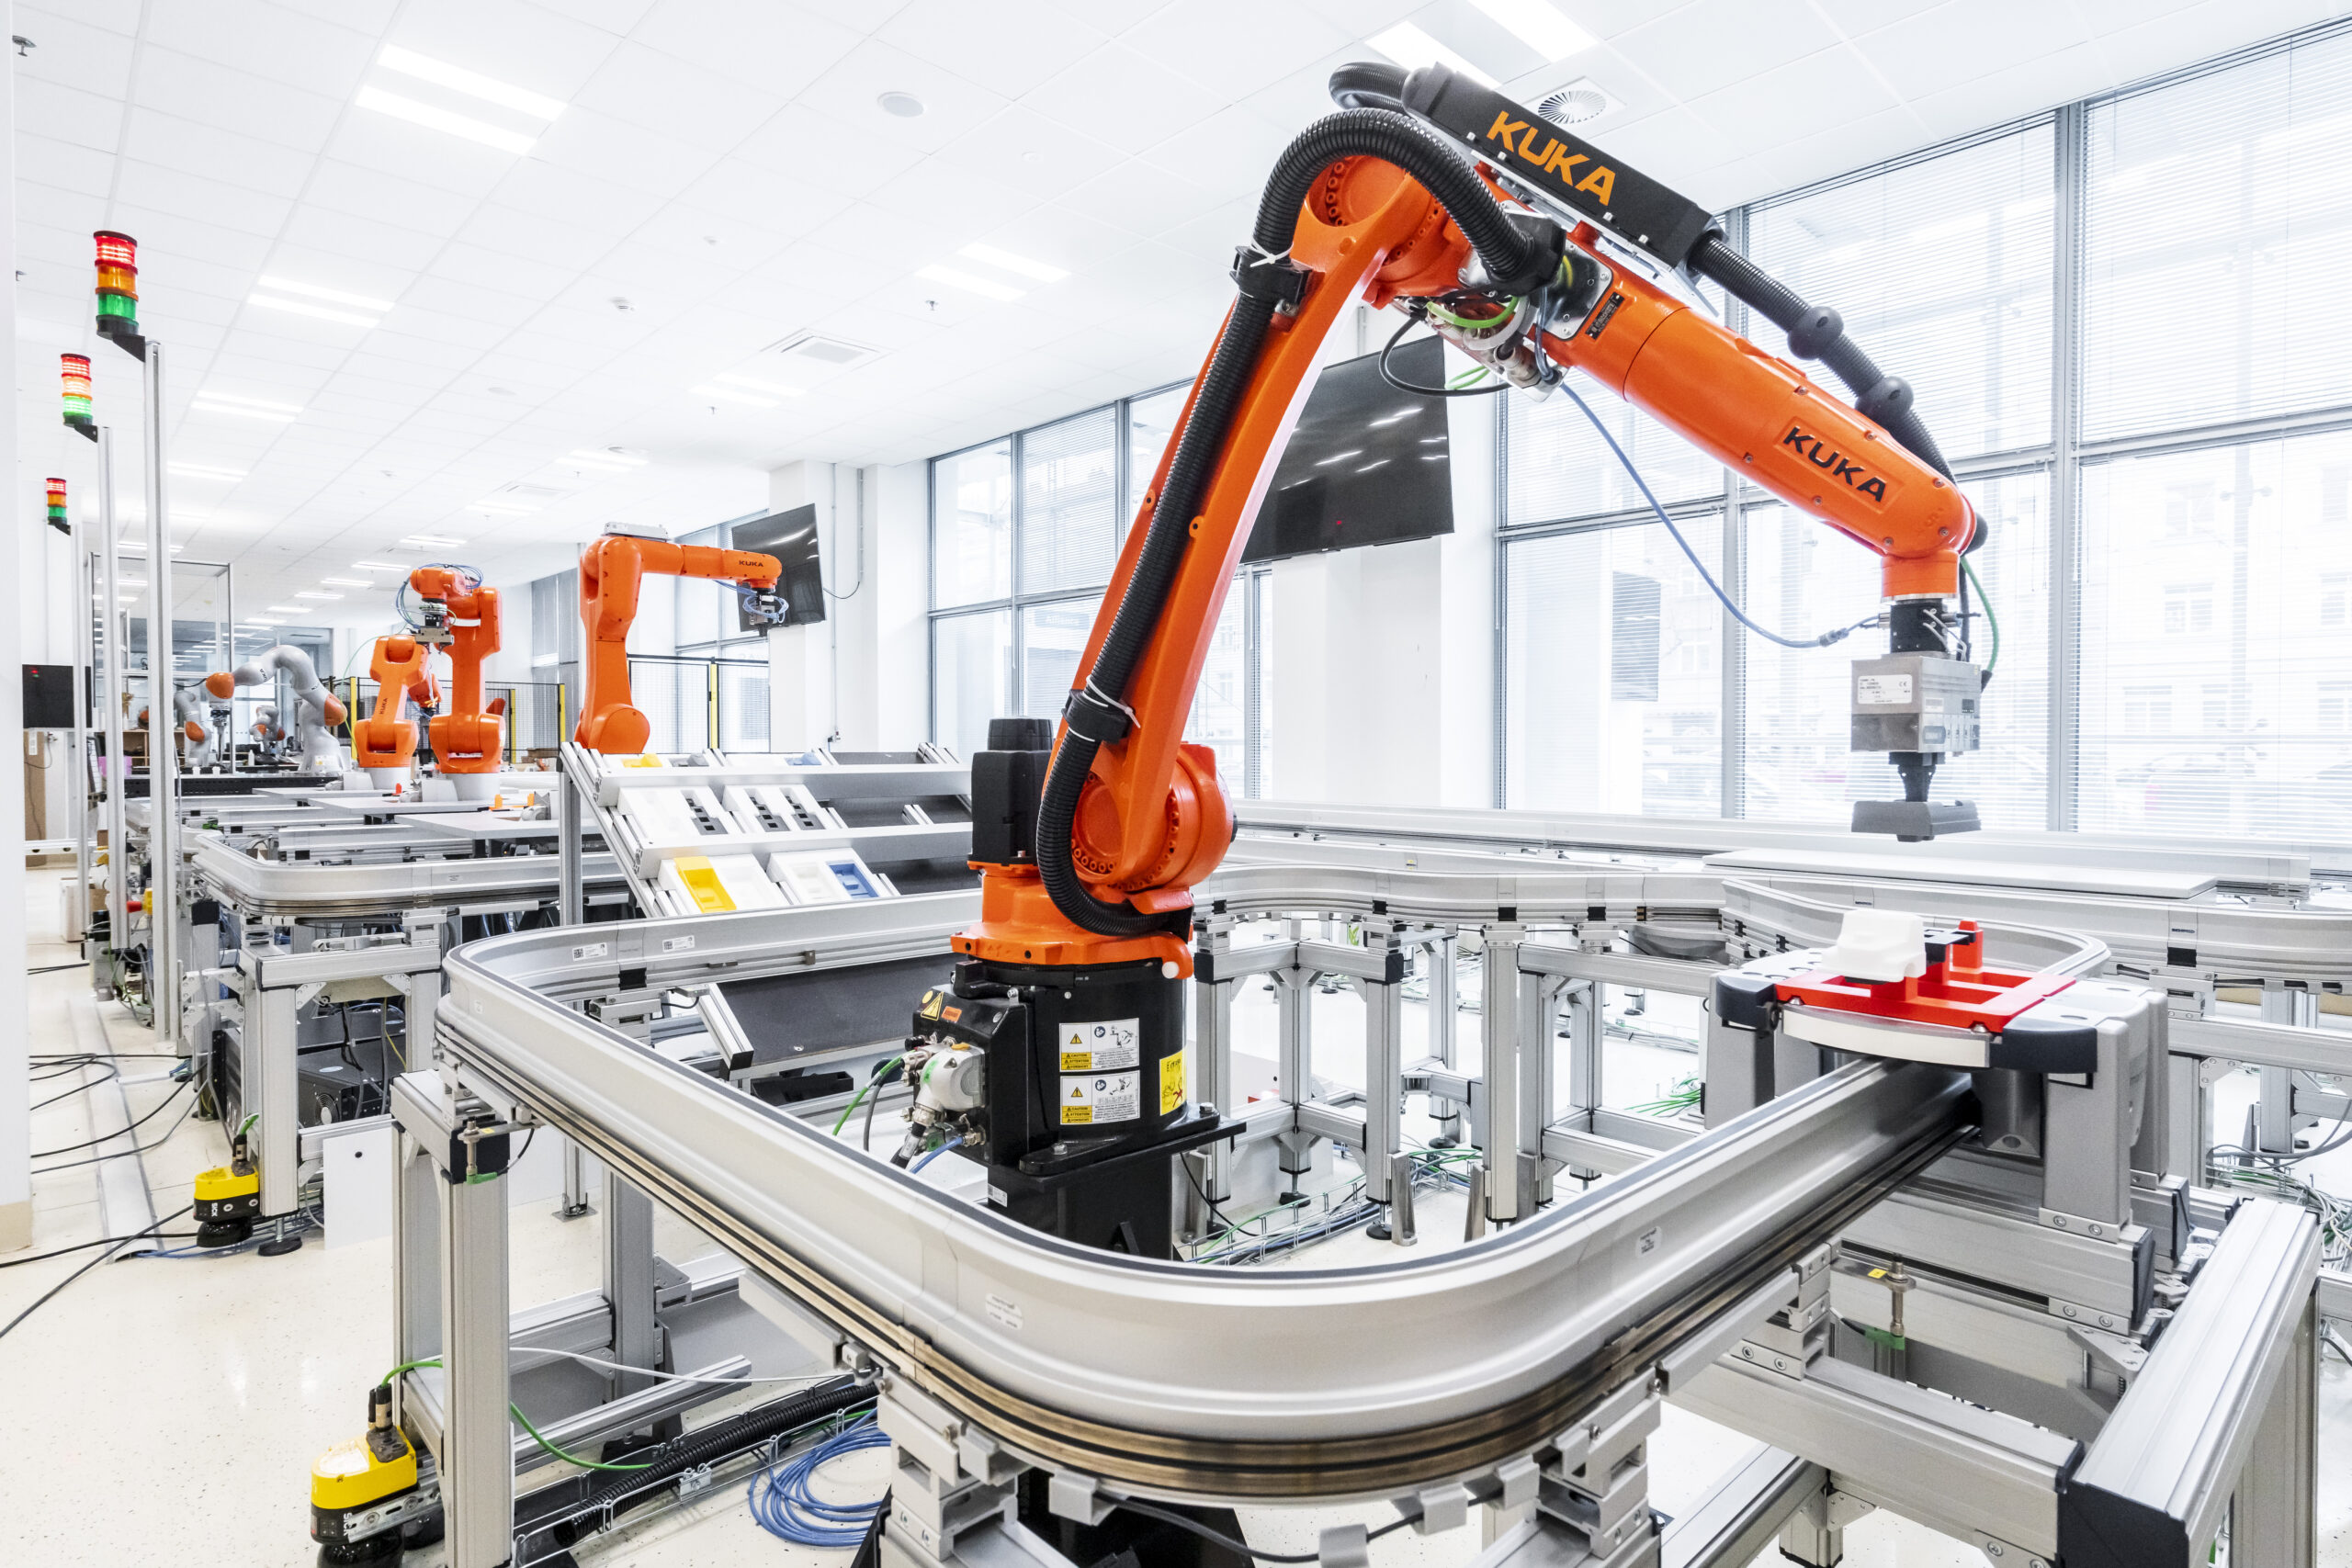
Introduction in Radio Frequency Identification Technology
By JOANNEUM RESEARCHThe learning material starts with asset tracking with Radio Frequency Identification (RFID). Asset tracking is an increasingly important key technology for industrial manufacturing companies. Digital asset tracking brings greater transparency to the production process, allowing you to see the progress and status of your production line at any time. In this learning resource, we explain exactly what the concept means and what the benefits are for companies.In this lesson, we will introduce the basic key concepts of RFID technology.
Digital learning, Lesson- Quiz1
-
 Intermediate
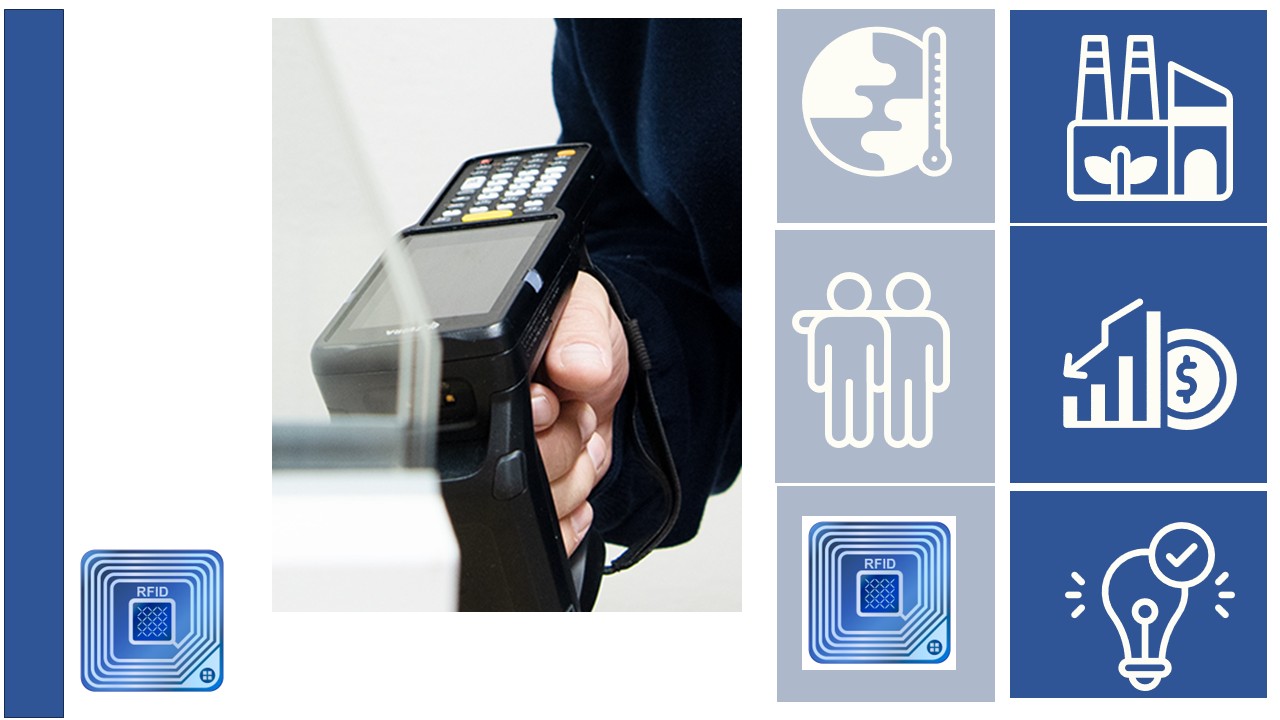
Radio Frequency Identification Readers
By JOANNEUM RESEARCHIn this lesson, we will describe Radio Frequency Identifier (RFID) readers. RFID readers are devices that use radio waves to identify and track tags attached to objects. The reader sends a signal that activates the tag, which then sends its unique identification information back to the reader wirelessly.
Digital learning, Lesson- Quiz1
-
 Intermediate
Ethernet Link Layer Discovery
By Czech Technical UniversityThis lesson demystifies how IEEE 802.1AB (LLDP) and its SNMP-exposed MIB let network devices advertise and collect rich, vendor-neutral metadata to build a live Layer-2 topology map. You will learn the manager/agent workflow—polling with GETBULK, correlating lldpLoc and lldpRem tables, and reacting to TRAP/INFORM events—to automate provisioning, monitoring, and fault isolation across multi-vendor networks.
Digital learning, Lesson- Quiz1